NVIDIA Dynamo prom metrics patch
Credits to Scicom (MSC) Berhad and Scicom AI Enterprise for the resources.
I serve an LLM with NVIDIA Dynamo. Its frontend exports latency metrics to Prometheus, and my dashboard said time to first token (TTFT) was about 2 seconds at p95.
What the dashboard could not tell me: is every request waiting 2 seconds, or only the ones with a long prompt? This post is about the small patch that answers that.
Dynamo can run prefill and decode on separate workers (disaggregated serving), which makes the question sharper: if TTFT is bad, I want to know whether to add prefill capacity, and for which kind of request.
The problem: one number for every prompt size
Dynamo exports a good set of metrics out of the box. NVIDIA lists them all in the Metrics Catalog. They have one gap.
Look at the labels on the latency histograms (TTFT, ITL, request duration). They carry model, and nothing about the request. Input length is exported too, but as its own separate histogram.
You cannot join two histograms. A Prometheus histogram is a set of counters ("how many observations were at most 0.5 s"), with no row per request. The TTFT histogram knows 900 requests came back in under half a second. The ISL histogram knows 4,000 prompts were under 1k tokens. Nothing records which were which.
So a 300-token chat turn and a 12,000-token RAG prompt go into the same TTFT histogram, even though prefill for the second one is far more work. When p95 moves, I cannot tell whether the system got slower or the traffic just shifted toward longer prompts. And I cannot tell which context length is the bottleneck.
Here is the same data both ways. Start on Stock, then switch to Patched.
Table view
| Input length (tokens) | Requests | TTFT p50 | TTFT p95 | TTFT p99 | ITL p50 | ITL p95 | Avg cached tokens |
|---|---|---|---|---|---|---|---|
| all requests | 17,944 | 0.17 s | 2.00 s | 5.29 s | 7.3 ms | 12.5 ms | |
| 0-512 | 4,700 | 0.07 s | 0.19 s | 0.22 s | 6.4 ms | 12.3 ms | 1 |
| 513-1024 | 16 | 0.08 s | 0.12 s | 0.20 s | 6.3 ms | 12.3 ms | 0 |
| 1025-2048 | 16 | 0.08 s | 0.20 s | 0.22 s | 6.7 ms | 12.4 ms | 0 |
| 2049-4096 | 118 | 0.23 s | 1.32 s | 2.02 s | 9.3 ms | 12.7 ms | 0 |
| 4097-8192 | 247 | 0.40 s | 3.98 s | 4.56 s | 9.3 ms | 12.6 ms | 30 |
| 8193-16384 | 1,067 | 0.58 s | 5.90 s | 9.18 s | 8.1 ms | 12.5 ms | 8,745 |
| 16385+ | 11,780 | 0.31 s | 2.06 s | 5.30 s | 7.4 ms | 12.5 ms | 21,074 |
The patch: an isl_bucket label
The fix is to label the latency histograms with the bucket the prompt falls in.
It is a small patch to the Dynamo frontend, on top of Dynamo 1.5.0. In general terms it does three things:
- Adds one opt-in setting on the frontend: a list of bucket boundaries, as inclusive upper bounds in tokens. Six boundaries make seven buckets, and each bucket becomes a label value:
0-512,513-1024, and so on up to the open-ended16385+. - Exports five more histograms next to the originals: TTFT, ITL, request duration, output length and cached tokens, each with an
isl_bucketlabel besidemodel. They use the samelebuckets as the originals, so a quantile from one is comparable to a quantile from the other. - Creates every bucket's series at zero when the model registers, so
rate()andincrease()do not miss a bucket's first burst of requests.
When does the frontend know the bucket?
At the first token. That is the point where the frontend has the prompt's token count and records TTFT, so the request's bucket is latched there and reused for everything after:
- TTFT is observed straight away, into the bucket's series.
- ITL goes through a request-local histogram, the same way the stock ITL metric does, so the per-token path stays cheap.
- Request duration, OSL and cached tokens are recorded when the request ends.
A request that fails before its first token never gets a bucket. It still shows up in dynamo_frontend_requests_total.
What it costs
Every bucket multiplies the series of five histograms. For one model and seven buckets that came to about 270 extra series per frontend, which is nothing for Prometheus. The patch refuses more than 32 boundaries so a typo cannot blow up cardinality.
When the setting is off, nothing extra is registered and requests pay nothing for it.
Querying it
p95 TTFT per bucket:
histogram_quantile(0.95,
  sum by (le, isl_bucket) (
    rate(dynamo_frontend_time_to_first_token_by_isl_seconds_bucket[5m])
  )
)
Mean TTFT per bucket:
  sum by (isl_bucket) (rate(dynamo_frontend_time_to_first_token_by_isl_seconds_sum[5m]))
/
  sum by (isl_bucket) (rate(dynamo_frontend_time_to_first_token_by_isl_seconds_count[5m]))
Without and with, on a real dashboard
The same Grafana panel, TTFT p95, over the same ten minutes of a load test.
Without the label, which is all stock Dynamo can give you:
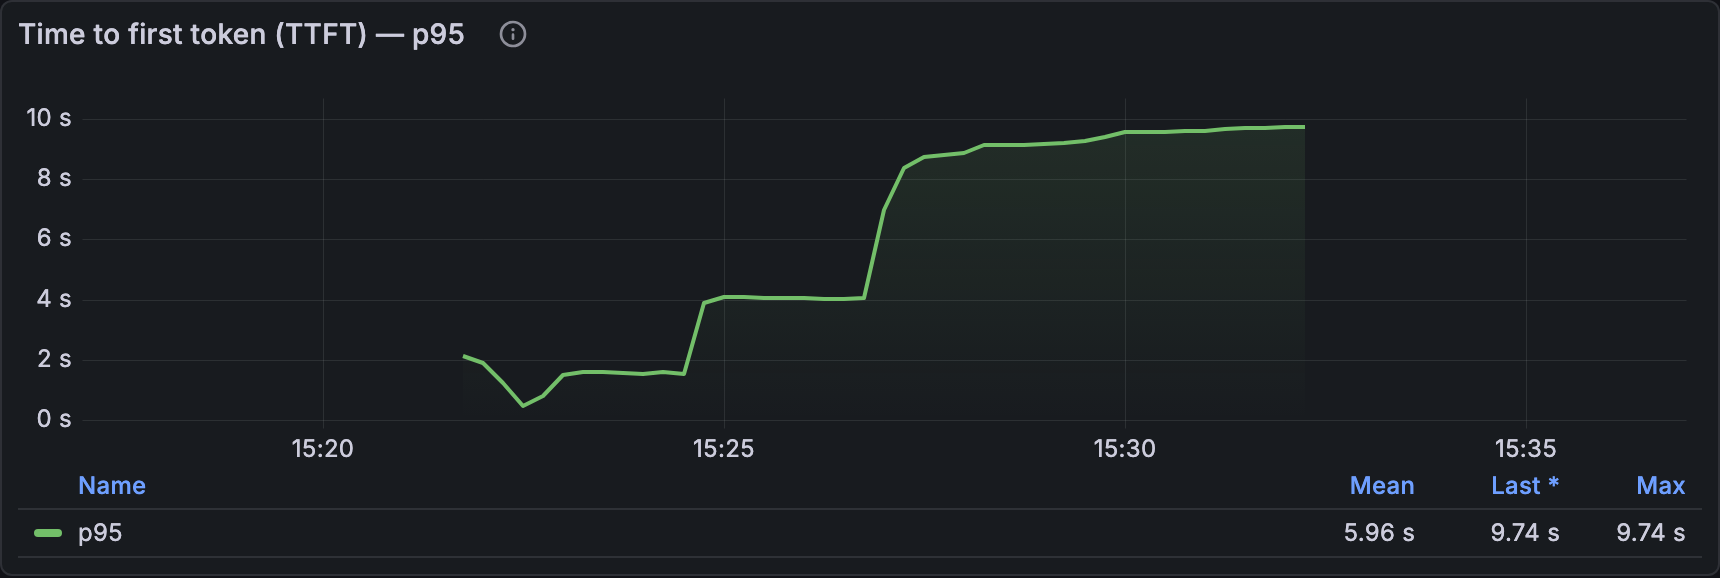
One line. It climbs from about 2 s to almost 10 s, and all I can say is that it got slow.
With the isl_bucket label:
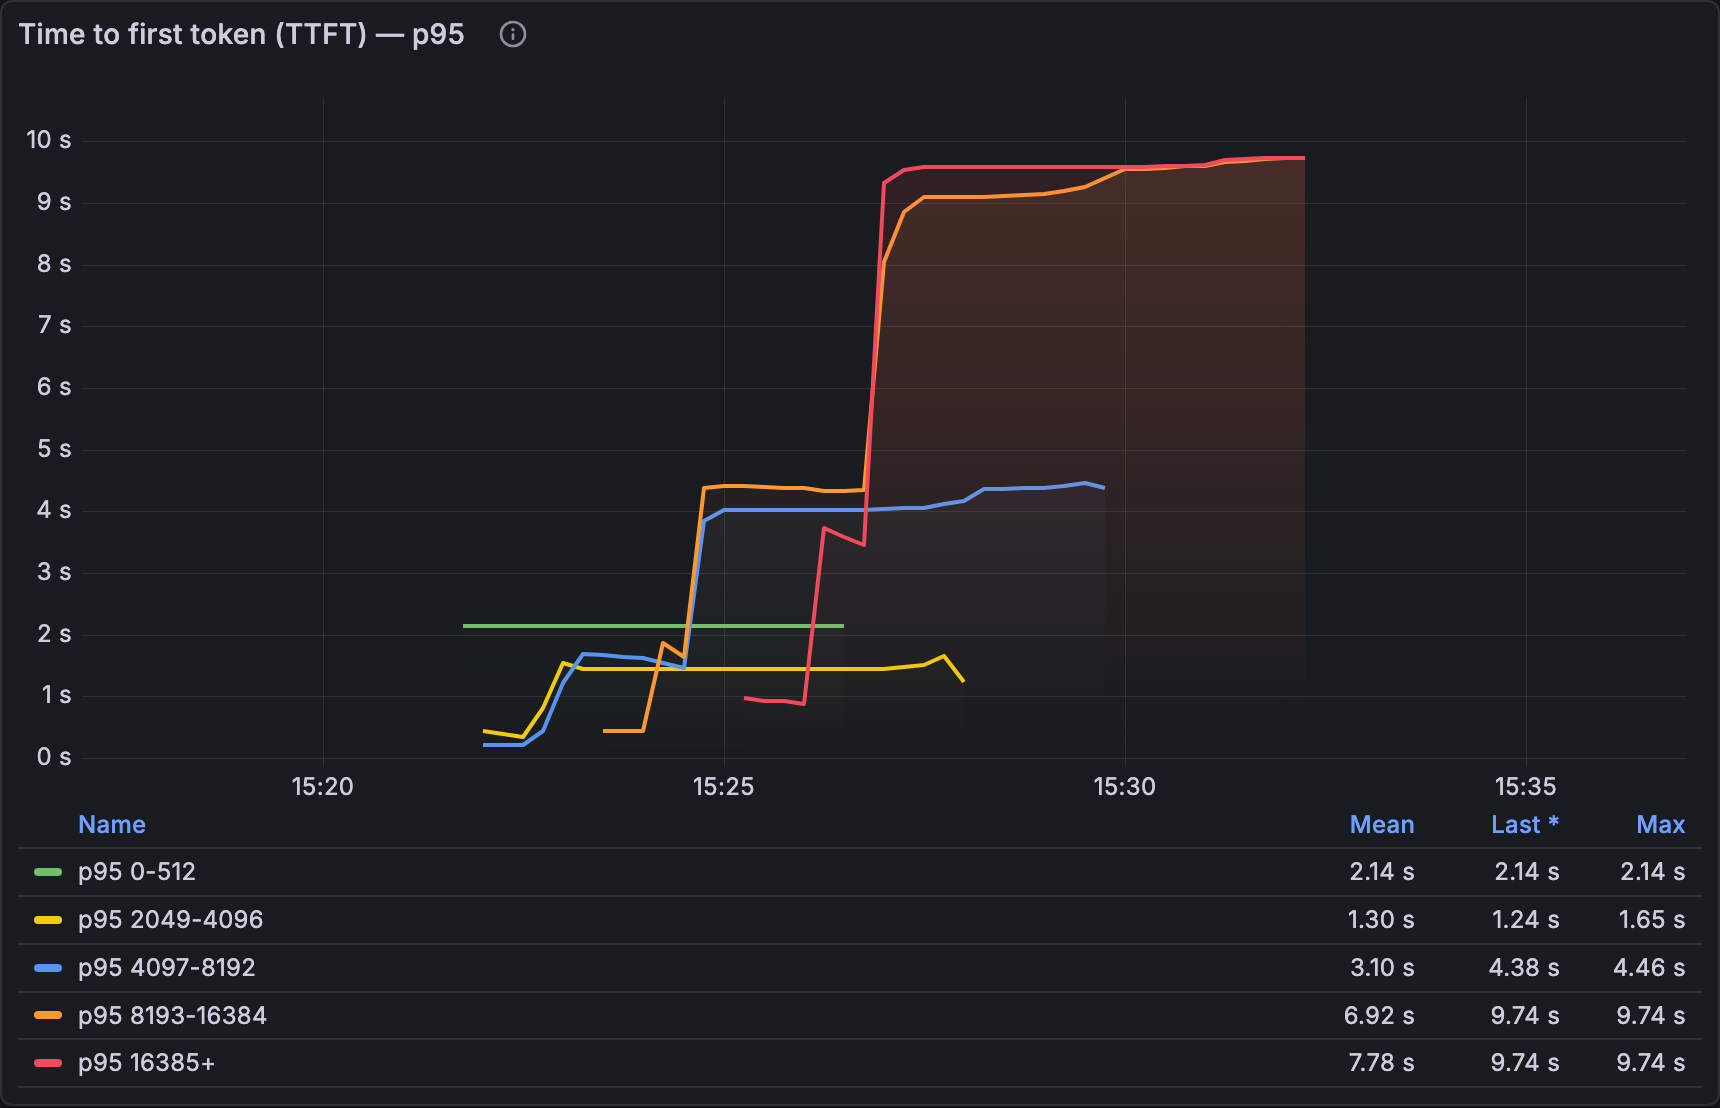
Five lines, and now there is something to act on. Prompts of 2k to 4k tokens stayed around 1.3 s the whole time. The 4k to 8k bucket settled near 4.4 s. Everything above 8k tokens went to almost 10 s, and that is what dragged the single line up.
Two things I learned building the dashboard:
- Bucket labels sort as strings, so
1025-2048comes before513-1024. On VictoriaMetrics, wrapping the query insort_by_label_numeric(..., "isl_bucket")puts them in order. - Give avg, p50, p95 and p99 their own panels. On one shared panel the p99 spikes set the y-axis and flatten everything else into a line along the bottom.
Conclusion
These metrics are worth having. With one latency number, a slow dashboard only tells me that something is slow. With one number per prompt-length bucket, when a bottleneck shows up, at least I know which bottleneck it is: which prompt sizes are waiting, and so where the capacity is short.